
Inbreeding Analysis
A single COI number isn't enough to make a breeding decision.
Most tools give you one number and leave you to figure out what it means. Is 8% a problem? It depends on the breed, on how complete the pedigree is, on where the inbreeding is concentrated, and on which ancestors are driving it.
Cat Breeder Pro gives you the full picture, not just a percentage. Every cat with pedigree data gets a complete inbreeding profile, calculated automatically across 10 generations, so you can actually interpret the numbers and use them.
Wright's Coefficient of Inbreeding (COI)
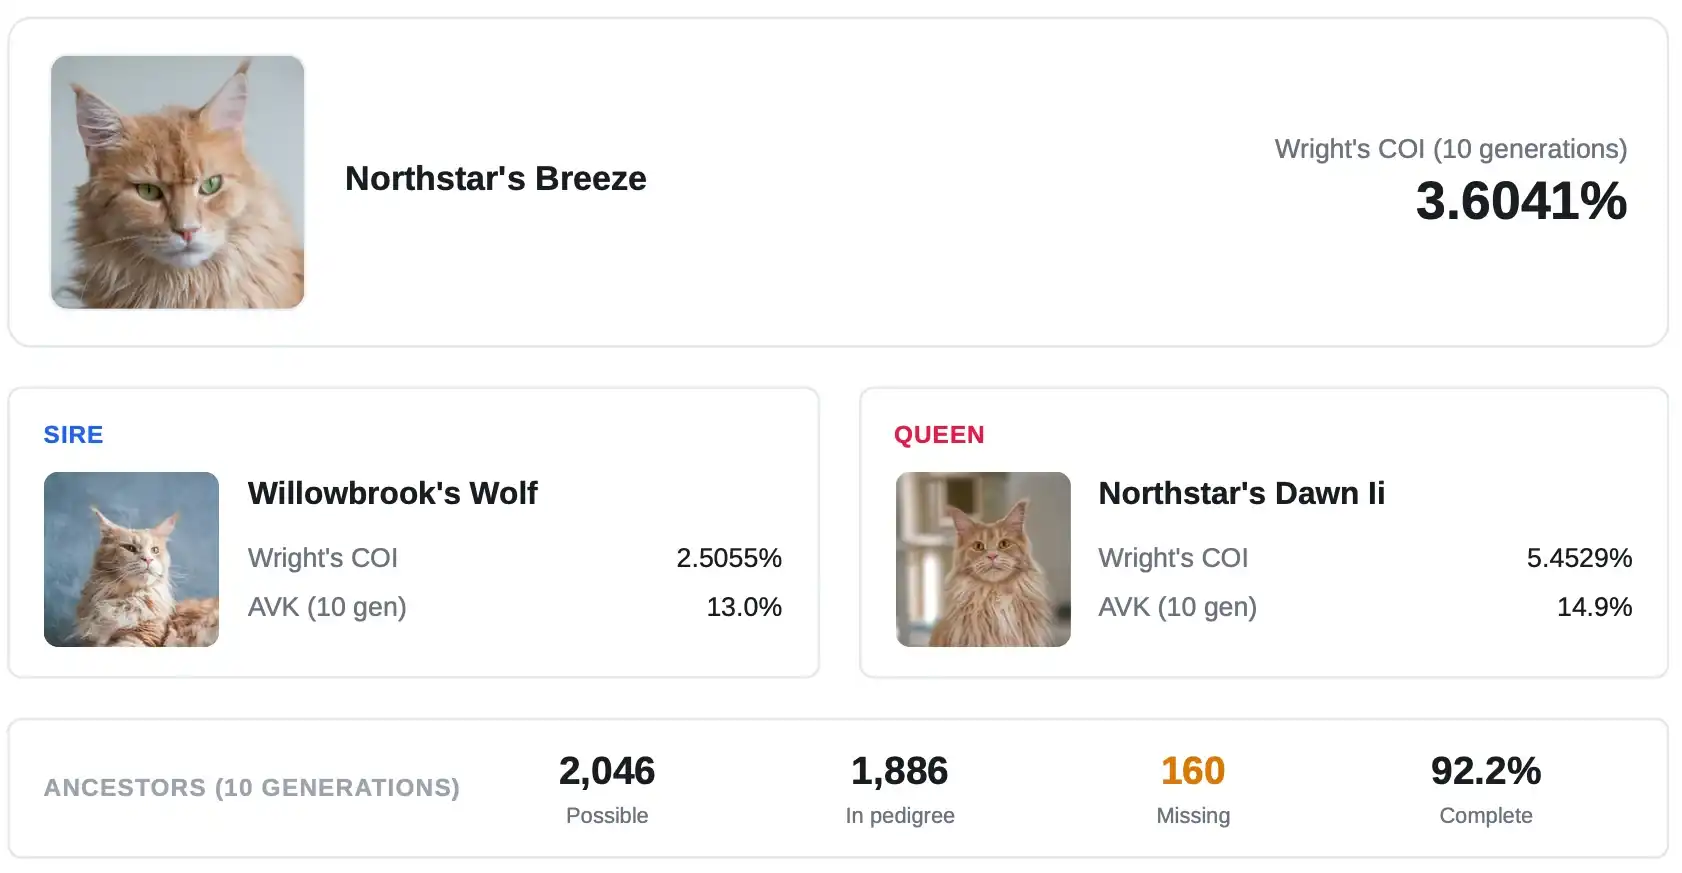
The headline number. The probability that your cat has inherited two identical copies of a gene from a common ancestor, one through the sire's line, one through the queen's. Calculated across 10 generations of pedigree data.
Right below it, you'll see the sire and queen in separate cards, each with their own COI and ALC. Before you've scrolled anywhere, you already know which side of the pedigree is contributing more.
Ancestor Loss Coefficient (ALC / AVK)
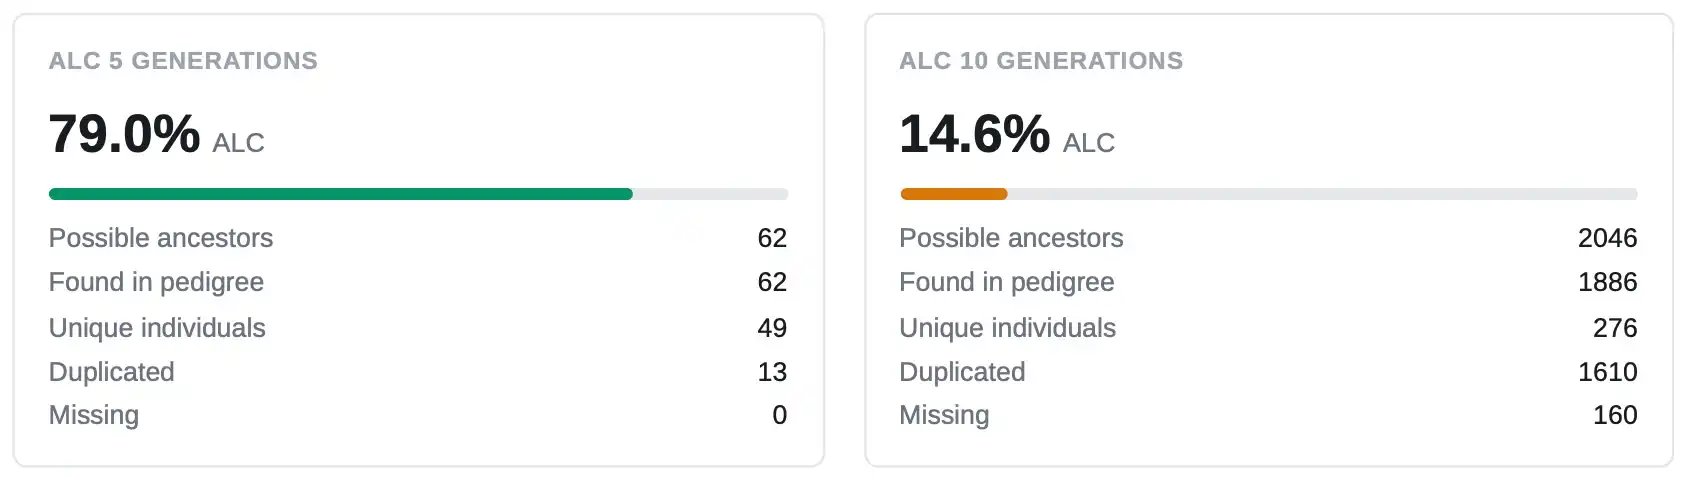
A 10-generation pedigree has 2,046 ancestor slots. ALC tells you how many of those are filled by unique cats.
Cat Breeder Pro shows this at both 5 and 10 generations, and the gap between them can be eye-opening. A cat might look fine at 5 generations, then at 10 you see hundreds of duplicated entries and an ALC that's dropped off a cliff. The pedigree has collapsed at depth, but you'd never know from the surface.
The raw numbers are shown alongside the percentage: possible ancestors, unique individuals, duplicates, gaps. You can see exactly what's behind the number.
One thing worth knowing: COI only picks up ancestors shared between the sire and queen lines. If one side of the pedigree heavily reuses the same cats but those cats don't appear on the other side, COI won't register it. ALC will.
Pedigree Completeness Index (PCI)
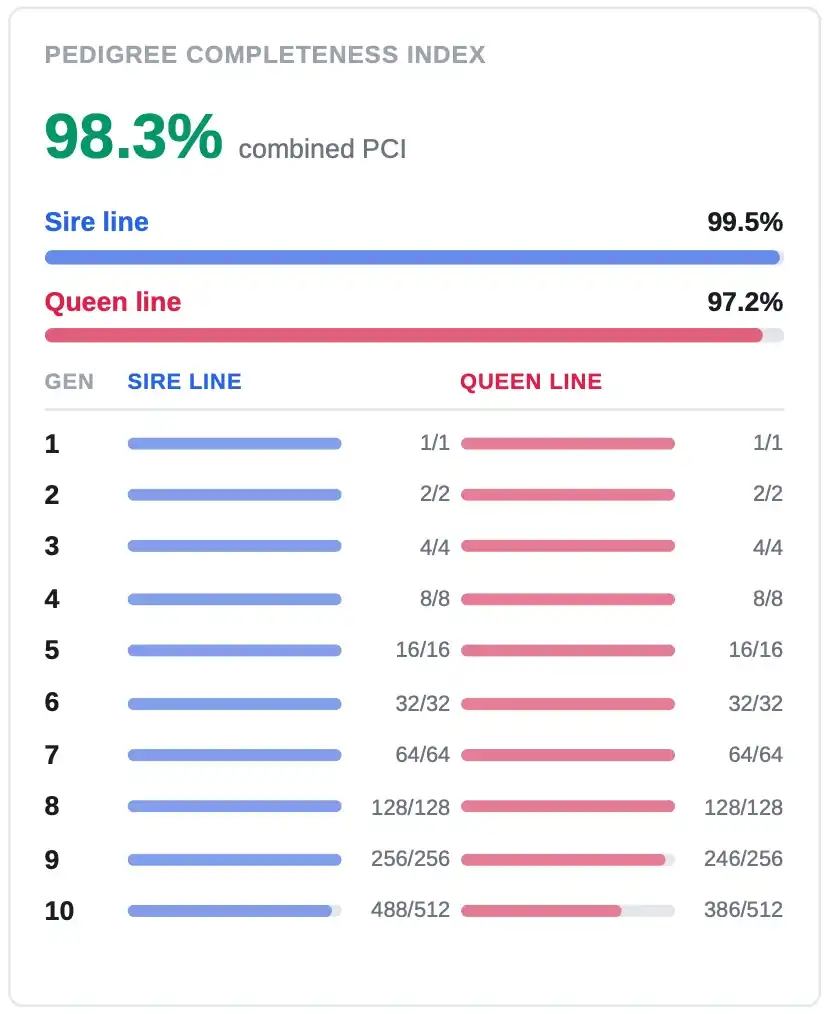
PCI tells you how complete your pedigree data is across both lines, and whether the coverage is balanced between them.
It uses a harmonic mean rather than a simple average, which means it reflects imbalance honestly. If the sire side is 100% complete but the queen side is only 20%, a simple average gives you 60%. PCI gives you 33%. When one side has major gaps, the PCI shows it.
The per-generation breakdown shows exactly where the gaps are on each side. If generation 9 on the queen line is where your data runs out, you can see it immediately and know where to focus your research. The more complete your pedigree, the more reliable everything else on the report becomes.
Effective Ancestors (fe)
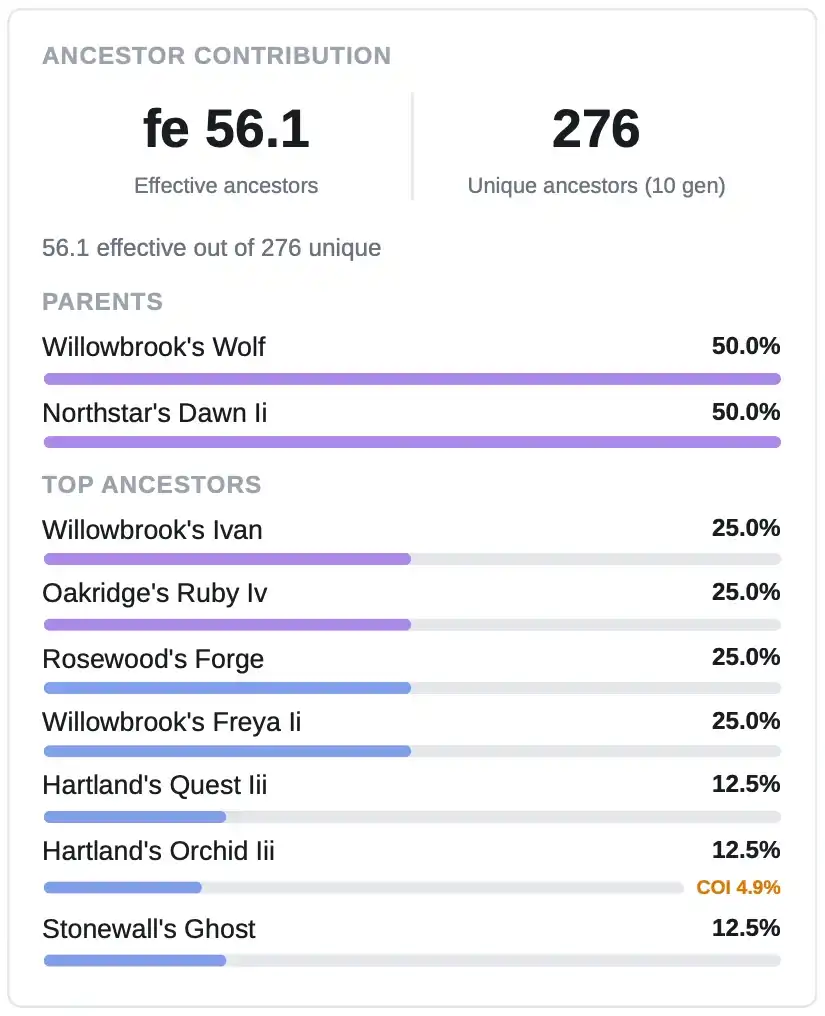
Unique ancestor count tells you how many different cats appear in the pedigree. Effective ancestors (fe) goes a step further: it tells you how that genetic influence is distributed. Are contributions spread broadly, or does a small group carry most of the weight?
Below the number, there's a ranked list of top contributors by blood percentage. You can spot a foundation sire from six generations back who's still contributing 15% because they appear in the pedigree over and over. If that ancestor is themselves highly inbred, a COI badge appears next to them.
It's also a useful way to see the popular sire effect at work at the individual cat level.
COI by Generation
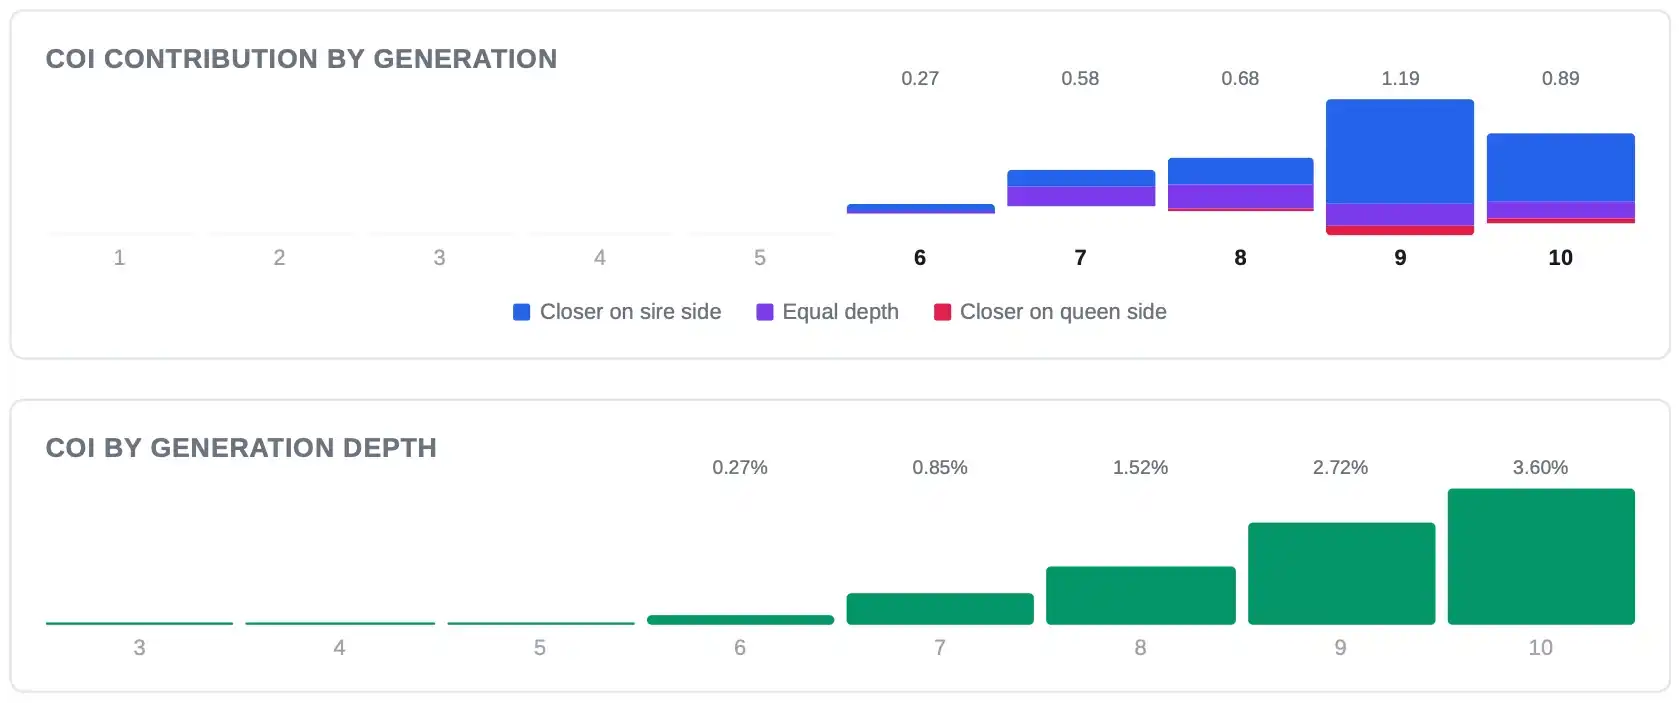
Two charts. The first shows which generations the inbreeding originates in and whether it leans toward the sire side or queen side. The second shows how the COI builds as you go deeper.
A COI that's concentrated in generations 2 and 3 is a very different situation from one that's spread thinly across generations 7 through 10. Recent inbreeding produces longer runs of homozygosity and carries more health risk. These charts make that distinction visible immediately.
COI Contributors
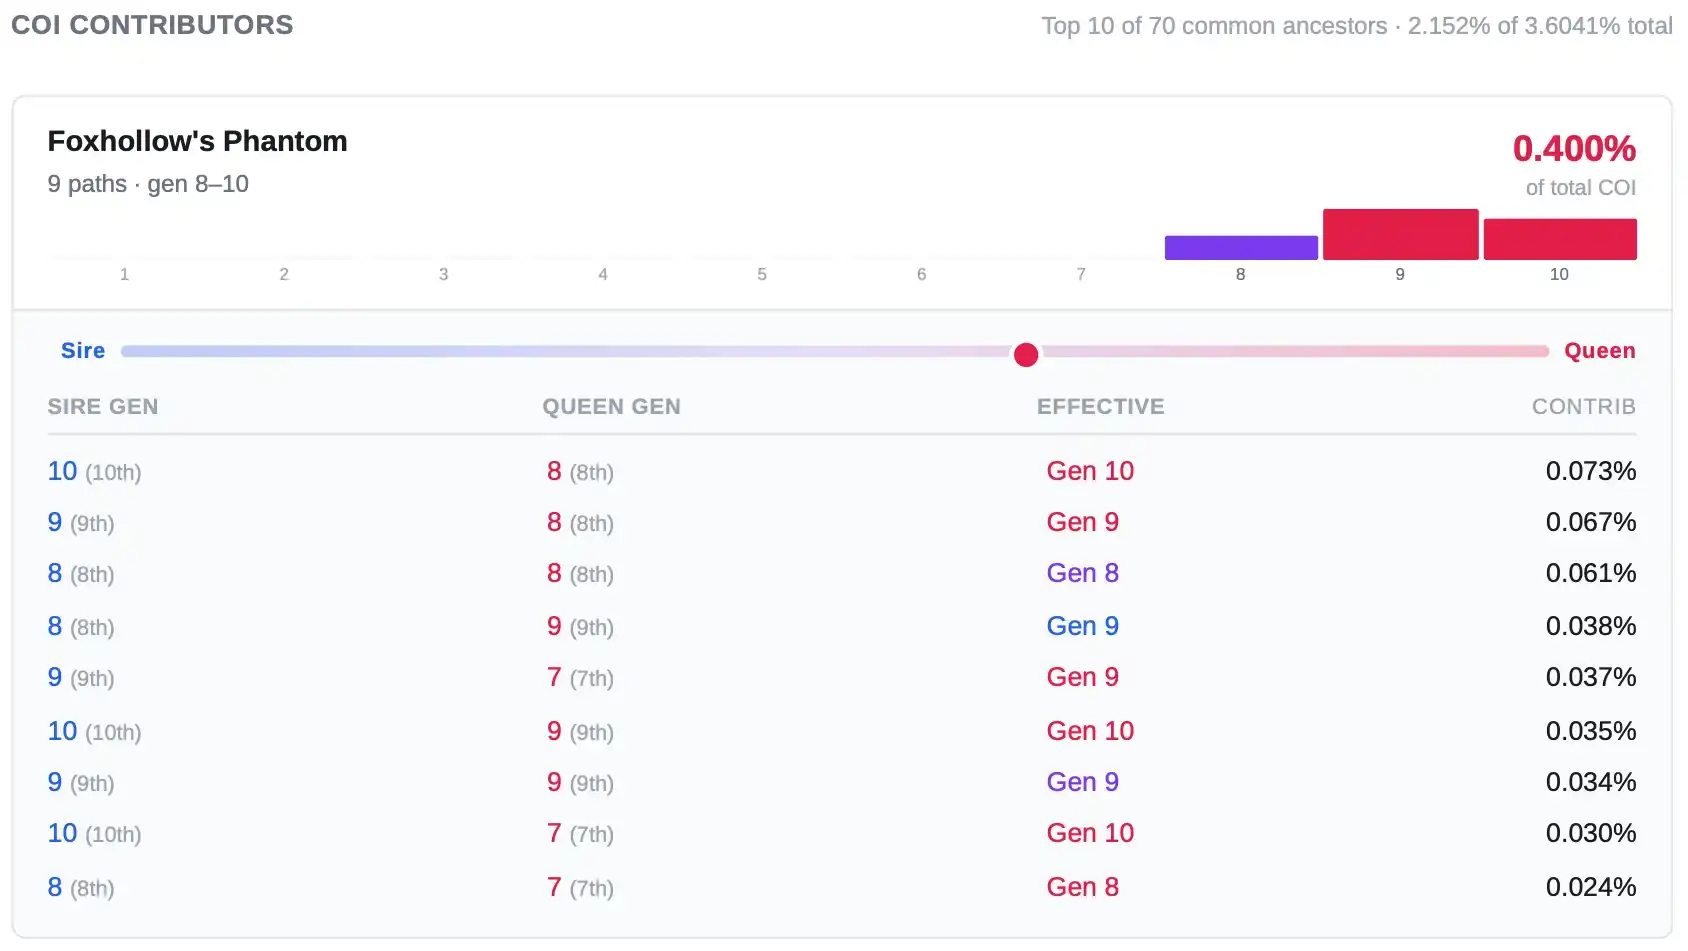
Every common ancestor between sire and queen, listed individually. Each one shows the number of paths connecting them, the generations they appear in, their exact contribution to the total COI, and a visual bar showing whether those paths run through the sire side, the queen side, or both.
You can see whether the inbreeding comes from one heavily-used ancestor or is spread across several. You can see whether it's sitting close to the surface or buried deep. A common ancestor at generation 2 contributes over 3% per path. At generation 8, it's 0.00001%.
Most tools don't give you this level of detail.
DNA COI alongside Pedigree COI
If you've had a cat DNA tested, you can record the genomic COI and see it alongside the pedigree-calculated value.
DNA COI scans the actual genome for runs of homozygosity, stretches where both copies of DNA are identical. It catches inbreeding from ancestors too far back for the pedigree to reach and doesn't depend on the pedigree being correct. But it's a single number. It can't tell you which ancestors are responsible or where in the pedigree the inbreeding is concentrated.
Pedigree COI can. And it's the only method that works forward in time. You can calculate the expected COI of a mating before any kittens exist. DNA can only measure a cat that's already here.
Both together: precision from DNA, context from the pedigree.
Trial matings — compare before you commit
Select a sire and queen and Cat Breeder Pro calculates the COI and ALC for the hypothetical litter. Run two or three stud options and compare. Which pairing keeps the COI lower? Which one maintains a broader ancestral base?
You make that call before you commit, not after.
Built on established science
The inbreeding analysis uses Wright's coefficient of inbreeding, the standard method used by geneticists and breed registries worldwide since its publication in 1922, calculated across 10 generations of pedigree data. ALC, PCI, and effective ancestor calculations follow established population genetics methodology.
See a full example report here: Download example report (PDF)